Introduction:
We've had a sharp sell-off in recent days, and in fact the market has been moving down for the past two weeks. Subscribers were well prepared for this move in advance. But we’re now getting to the point where the market is getting oversold, and the odds of a new rally are increasing dramatically. It is my view that there will be at least one more good rally, particularly on the overseas markets, before world markets start heading down in earnest again. As a result, one should be taking profits on one’s recent short positions, and looking to go long (buy) the market. A number of stocks are pulling back to buy levels at the moment, and we show charts of three of them this week.
Starting with the S&P 500 index chart. It is reaching its downside target today from a short-term head and shoulders. Start taking profits on shorts, and look to go long soon. The JSE All Share index has a slightly lower target, but one should also be taking profits on shorts there. On the commodities front, the gold price ($) has higher targets after a recent upside breakout; it’s pulling back temporarily right now. Concerning the rand, if the USD/ZAR maintains its weakness into this Friday’s close, it will continue weakening for longer. The stock charts shown are Truworths (pulling back to buy levels), Sanlam (look to buy again), and Brait (reversing up off important support).
Overall, after a good and heathy correction on the local and oversees markets we are getting close to another rally. Many stocks are setting up new buy signals. There is a chance coming up for traders to capitalise by buying for a short-term rally. Therefore, look to take profits on recent shorts. However, as always, don’t just jump in, but follow the exact signal as given.
Executive Summary:
-
S&P 500 (chart 1): Take half trading profits now on shorts, and tighten stop to a prior one-day high.
-
Truworths (chart 2): Buy on the next reversal day up, or breaking above its previous days high.
-
Sanlam (chart 3): Buy on the next reversal day up from current levels or lower
-
Brait (chart 4): Buy on the next reversal day up.
-
Shortable stocks/instruments: 4
UPDATE OF LAST WEEKS THREE STOCK CHARTS:
Aspen: after an initial rally stopped about 50c short of our stop tightening level, it then reversed down sharply on Tuesday to trigger the stop. Yesterday it was back up again which is very frustrating. If it gave a reversal day/candle up yesterday as well, so buy it again. Take profits at 339-342. Stop a close below 316.
SABMiller: has given a new upside breakout. It can be bought now. Take partial profits at R923, then look for a further move up to the R945 level. Stop a close below 876. From R923 raise the stop to a close below 893.50. From 929 raise the stop again to a breaking of its prior two-day low, and take all profits at/near R945 if reached.
Anggold: triggered the upside breakout to buy. Continue to hold. Target is 239 for half profits. Then 241. Raise stop now to your entry (breakeven). And from R237.50 raise the stop again to a breaking of its prior one-day low to protect profits.
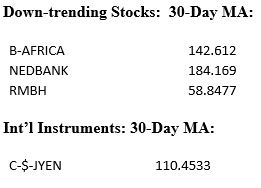
SHORTABLE (DOWN-TRENDING):
Please note:
-
We list the stocks, and indices (local and overseas) that are in well-established downtrends and that can be sold short (see Glossary for definition), on rallies to resistance.
-
Selling short can be done via single stock futures, CFDs, spread trading, and/or put warrants.
-
One way of trading these stocks/indices is to sell short rallies to the falling 30-day moving average. The moving average tends to act as loose resistance. Wait for a downward reversal at the moving averages before selling short.
-
NOTE 1: ALWAYS USE PROTECTIVE STOPS ON ALL POSITIONS. Selling short is for short-term traders only, and all positions must be monitored closely.
-
NOTE 2: The instruments on this list are not automatic shorts, but it is a starting point for looking. Always look at the chart first before making a final decision.


OVERALL SUMMARY
We've entered the proverbial ‘sell in May and go away’ season, and May is historically a weak month on the US indices. However, I’m looking for a new short-term rally to begin very soon. That should take us up to the mid/20th May time frame.
Subscribers were well prepared in advance for the recent correction on the market, but that is likely coming to an end very soon. The big drop however is still to come, but in a few months time.
So in the meantime, there are short-term trading opportunities both ways, with a new rally likely to get underway soon.
An area of interest right now is the rand, which has weakened dramatically over the past two days. The US dollar index itself (not shown) is rallying off important support for it. If the rand remains weak intoFriday’s close then expect it to continue weakening for a while longer. Rand hedge stocks will benefit then and some of these have already given good rallies; expect follow through if the rand is still weak by Friday’s close.
As a general strategy, it’s important to still keep position sizes smaller than usual because we’re in a difficult trading environment. And look to lock in profits quicker than usual, as they arrive.
Overall though the market doesn’t look quite ready to come down in earnest just yet. It will happen though, with great shorting opportunities to still come this year.
NEXT COURSE DATES:
JOHANNESBURG:
Course 1: Technical Analysis - 29th May 2016 (Sunday)
Course 2: Advanced Technical Analysis and Money Management - 12th June 2016 (Sunday)
Course 3: Developing Trader Discipline (Trading Psychology) - 10th June 2016 (Friday)
Please email us if you’d like to attend. Course details here.