ETF Tuesday: Db x-tracker (now Sygnia) MSCI Japan Index ETF
Suitability: Foreign exposure is an important way to achieve diversity in your investment portfolio. This is the second of a series of three notes looking at ETFs that are available to give you exposure to specific geographic regions. This week we look at Japan.
Generally, developed economies have less pronounced investment risks. Political environments are usually more predictable, while many emerging markets have a large exposure to resources industries. Increasing exposure to a developed economy such as Japan can have diversification benefits for your portfolio – including increased representation of industries that are underrepresented in emerging economies such as high tech and pharmaceuticals.
Of the many options available to gain exposure to international investment opportunities, ETFs present one of the most efficient ways of doing so.
The x-tracker MSCI Japan ETF offered by Deutsche Bank is suitable for investors wanting exposure to developed and more stable economies. It is well diversified but has risks inherent in equities investments as well as currency risk, so you still have to be prepared for uncertain returns.
What it does: The fund mimics the price and yield performance of the MSCI Japan index. The MSCI Japan index is a market cap index that is designed to measure large- and mid-cap segments of the Japanese stock market. It has 318 constituents and covers approximately 85% of the free float-adjusted market capitalisation in Japan. Free float means they exclude tightly held shares held by strategic investors such as governments, corporations, controlling shareholders and management, as well as shares subject to foreign ownership restrictions. This ensures that the fund invests in the most liquid stocks.
Advantages: Since the fund is rand-settled, it means you can invest in Japanese stocks without any exchange control issues – it does not count to any foreign exposure limits. By buying just one rand-denominated unit of the ETF you have access to a broad spread of Japanese equities. Also, while registered in Japan, most of the stocks tracked by this fund have significant export and international operations, which increases their diversification and attractiveness.
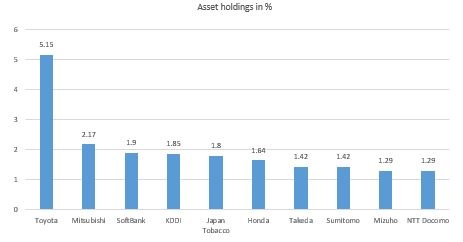
Top holdings: The top 10 holdings of this fund occupy 20% of the fund. The biggest one, Toyota, constitutes only 5%, which presents great diversification compared with most JSE-listed market cap weighted ETFs.

Risk: This is a pure equities investment, so the performance is likely to be volatile. Investment in this fund exposes you to a number of risks including general market risks, exchange rate risks, interest rate risks, inflationary risks, liquidity risks and legal and regulatory risks.
Fees: For the year to end-March, 0.86% of the average net asset value of the portfolio was incurred as charges, levies and fees related to the management of the portfolio. While this is slightly elevated compared with most local equity ETFs, it is far lower than what one would incur using other means of gaining offshore exposure.

Historical performance: The fund’s performance depends on how you invest – through a single lump-sum payment or regular payments. A lump-sum investment (which tracks the index’s movements more accurately) of R1,000 made five years ago would be worth R2,424 today. The table below reflects the fund’s historical returns in percentage terms for a lump-sum investment.

Fundamental view : This investment is tantamount to taking a short (negative) position on both the rand and the SA economy; or alternatively, it is taking a positive view on the both the yen and the Japanese economy. So your return is influenced by the yen’s value, the rand’s value and stock market returns.

The Japanese economy has been trapped in low growth for a long time but its government forecasts GDP to grow by 1.7% in 2016 from 1% in 2015. Its central bank has maintained an expansionary policy which was radically enhanced with the appointment of prime minister Shinzo Abe in December 2012.
Japan has a robust export market which has been helped by a weak yen (against the dollar). But exports are expected to fall due to decelerating growth in emerging economies led by China, one of its major export markets. Furthermore, businesses in Japan – though they have recorded record profits in recent times buttressed by the weak yen – are reluctant to commit capital expenditure to invest in Japan because of concerns about demand due to a shrinking and aging population. Japanese companies therefore, in the main, opt to invest overseas. The upside is that Japanese companies stand to earn better returns by investing in high-growth economies as well as from exchange rate gains. Another bright spot in Japan’s economy is tourism, boosted by Chinese visitors who visit on shopping sprees. Its tourism industry is expected to generate up to ¥5trn (about $50bn) in 2016.
However, there is a consumption tax hike pencilled for next year (the second one in recent years), which might provide a short-term boost to demand prior to the hike, but is likely to see a decline in consumption thereafter.
On the currency front it is important to note that this ETF has derived significant returns from exchange rate gains, which accounted for more than 50% of the total fund return over the past five years. Compared with its offshore JSE-listed ETF peers – which derived substantially all their return from exchange rate gains – the DBX Japan had a better balance between foreign currency return and stock market return. So marked rand movements can either hurt or enhance your portfolio returns.
Alternatives: As an alternative to this ETF, you may consider DBX FTSE 100 and DBX USA, which invest in the UK and US respectively. We will look at DBX UK next week. Another option is the DBX World which diversifies across those markets and others.
BACKGROUND: Exchange traded funds (ETFs)
Exchange Traded Funds (ETFs) are passively managed investment funds that track the performance of a basket of pre-determined assets (in this case, industrial companies). They are traded the same way as shares and the main difference is that whereas one share gives exposure to one company, an ETF gives exposure to more than one company in a single transaction. ETFs can be traded through your broker the same way as shares, say, on the Easy Equities platform. In addition, it qualifies for the tax-free savings account, where both capital and income gains accumulate tax free.
Risk: This is a pure equities investment, so the performance is likely to be volatile. Investment in this fund exposes you to a number of risks including, general market risks, exchange rate risks, interest rate risks, inflationary risks, liquidity risks and legal and regulatory risks.
Fees: For the year to end-March, 0.86% of the average net asset value of the portfolio was incurred as charges, levies and fees related to the management of the portfolio. While this is slightly elevated compared with most local equity ETFs, it is far lower than what one would incur using other means of gaining offshore exposure.
Benefits of ETFs
- Gain instant exposure to various underlying shares in one transaction
- They diversify risk because a single ETF holds various shares
- They are cost-effective
- They are liquid – it is usually easy to find a buyer or seller and they trade just like shares
- High transparency through daily published index constituents
You can check out other ETF Tuesday posts here.
Disclaimer
This research report was issued by Intellidex (Pty) Ltd. Intellidex aims to deliver impartial and objective assessments of securities, companies or other subjects. This document is issued for information purposes only and is not an offer to purchase or sell investments or related financial instruments. Individuals should undertake their own analysis and/or seek professional advice based on their specific needs before purchasing or selling investments. The information contained in this report is based on sources that Intellidex believes to be reliable, but Intellidex makes no representations or warranties regarding the completeness, accuracy or reliability of any information, facts, estimates, forecasts or opinions contained in this document. The information, opinions, estimates, assumptions, target prices and forecasts could change at any time without prior notice. Intellidex is under no obligation to inform any recipient of this document of any such changes. Intellidex, its directors, officers, staff, agents or associates shall have no liability for any loss or damage of any nature arising from the use of this document.
Remuneration
The opinions or recommendations contained in this report represent the true views of the analyst(s) responsible for preparing the report. The analyst’s remuneration is not affected by the opinions or recommendations contained in this report, although his/her remuneration may be affected by the overall quality of their research, feedback from clients and the financial performance of Intellidex (Pty) Ltd.
Intellidex staff may hold positions in financial instruments or derivatives thereof which are discussed in this document. Trades by staff are subject to Intellidex’s code of conduct which can be obtained by emailing mail@intellidex.coza.
Intellidex may also have, or be seeking to have, a consulting or other professional relationship with the companies mentioned in this report.
Subscribe To Our Research Portal
Search all research
Let Us Help You, Help Yourself
From how-to’s to whos-whos you’ll find a bunch of interesting and helpful stuff in our collection of videos. Our knowledge base is jam packed with answers to all the questions you can think of.

