
The Finance Ghost explains that ETFs are a great way to spread out investments across different markets affordably. They also point out that ETFs can be more actively useful than we usually think - making it more helpful for our investment choices, making them broader and more cost-effective.
Let me get this out the way right up front: ETFs are great. They really are. They allow you to easily increase your overall market exposure via a low-cost structure, making them perfect candidates for a personal finance wealth creation strategy built around putting money away every month into the market.
ETFs form the cornerstone of any Tax-Free Savings Account (TFSA).I firmly believe that a TFSA should be the first investment goal of any given year. By building up that TFSA balance over a lifetime, you’re creating a terrific pool of money with which to build wealth and generate capital gains and dividends that are not taxable.
Passive vs. active – or perhaps not?
The debates around active vs. passive management will rage on forever. Perhaps the bigger question is high cost vs. low-cost strategies, as even a strategy using only ETFs still has active elements.
But that doesn’t sound right, does it? How can ETFs be an active strategy?
You see, the term “passive” within an ETF refers to the allocation of assets being made by that ETF. There are rules rather than emotions, usually related to a specific index. Regardless of how the portfolio manager of a JSE Top 40 ETF feels on the day, the underlying exposure will be exactly the same.
In an actively managed portfolio, there is a broad mandate related to style and exposure, but the decisions made within that mandate will vary. You can have a fund that uses the Top 40 as a benchmark and which invests only in South African equities, yet it can have a portfolio that looks totally different to the Top 40.
Within the different strategies, it’s therefore easy to see why ETFs are considered passive when compared to how traditional asset managers operate. This active vs. passive classification misses the first step in the decision: the choice of ETF(s)!
In my view, the right way to think about this is an active approach to choosing passive instruments. ETFs offer a wide range of potential exposures, so the choice of ETF cannot ever be considered a passive decision.
Digging into some ETFs will hopefully make that point clearer to you.
Popular ETFs: offshore is lekker
Here are some of the most popular ETFs on EasyEquities, based on recent investor data:
- Satrix S&P 500 ETF
- Sygnia Itrix S&P 500 ETF
- Satrix Nasdaq 100 Feeder Portfolio
- Satrix MSCI World ETF
- Satrix 40 ETF
Unsurprisingly, there’s a heavy tilt towards offshore investments on this list. This warms my heart, as I firmly believe that broad market exposure makes the most sense in countries that are growing. Much as I love South Africa, I have no broad exposure to the local index, and I can’t see myself changing my mind anytime soon. In the same way that Dricus du Plessis had to travel to North America to reach the top, so too does my money!
Not everyone will agree with this view, which is precisely why we have a market. I wish them luck. My interest on the JSE lies in stock-picking, with broad exposure reserved for global indices.
The American market
Let’s start with the two S&P 500 ETFs. A quick look at the Satrix S&P 500 Feeder ETF Minimum Disclosure Document reveals the following top ten holdings as of December 2023: 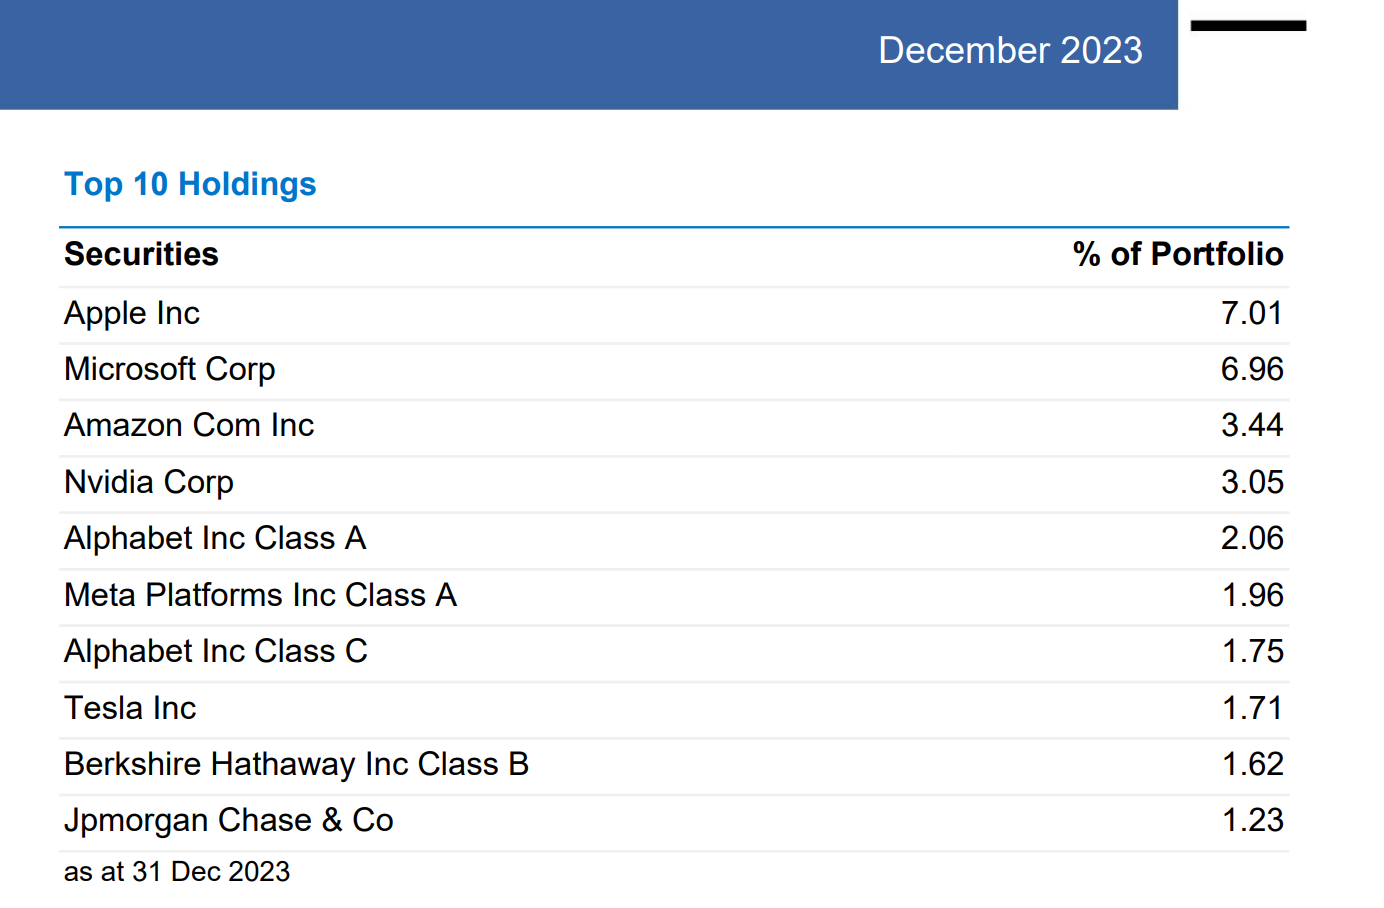
Source: Satrix S&P 500 Feeder ETF Minimum Disclosure Document, December 2023
As you can see, buying the S&P 500 doesn’t exactly scope you out of the world’s leading technology companies. The Nasdaq might have the reputation for being where you’ll find the “Magnificent 7” style of stocks, yet the S&P 500 offers only two non-technology companies in the top ten holdings. I might add that Berkshire Hathaway also has considerable look-through exposure to Apple!
The total expense ratio of the Satrix product is 0.25%. For comparison purposes, the Sygnia Itrix S&P 500 ETF has a total expense ratio of 0.20% and naturally has the same underlying stocks, as it tracks the same index. Another important difference is that the Satrix product doesn’t pay out distributions (they are reinvested), whereas the Sygnia product pays distributions twice a year. The distribution strategy is likely to be a bigger factor in the final decision between these two ETFs than the small difference in costs.
With the S&P 500 out of the way, we can now consider the Satrix Nasdaq 100 Feeder Portfolio. Here’s what the top ten looked like at the end of December 2023:
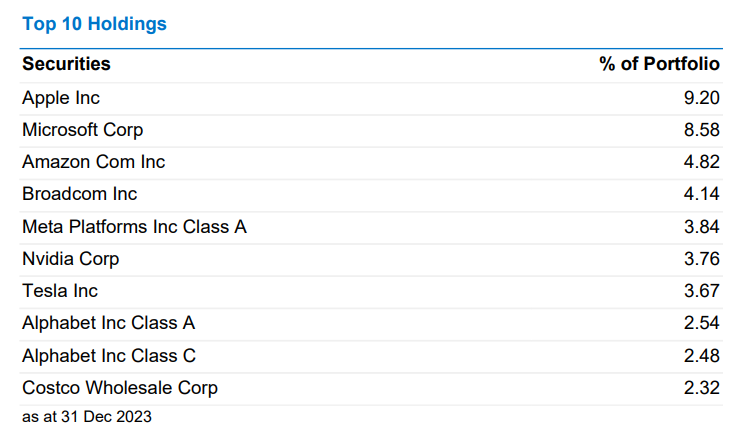
Source: Satrix Nasdaq 100 Feeder ETF Minimum Disclosure Document, December 2023
Apple, Microsoft, and Amazon are the top three positions in both the S&P 500 and the Nasdaq 100 but look at the different weightings. On a combined basis, they contribute 17.4% of the S&P 500 and 22.6% of the Nasdaq 100.
You’ll notice a couple of other important differences, like the inclusion of Broadcom as the fourth largest position in the Nasdaq 100. This stock wasn’t even in the top ten in the S&P 500. Despite the market often assuming that the Nasdaq 100 is exclusively about technology groups, you’ll notice that retailer Costco is the tenth largest position!
The Nasdaq isn’t exclusively a technology-focused stock exchange. It has simply evolved in such a way that it has a higher tilt towards technology than the S&P 500. It’s hard to see the difference this makes unless you dig a lot deeper than just the top ten exposures.
Thankfully, the sector allocation charts in the Minimum Disclosure Documents make this quite easy. Here’s the chart for the Satrix S&P 500 Feeder ETF:
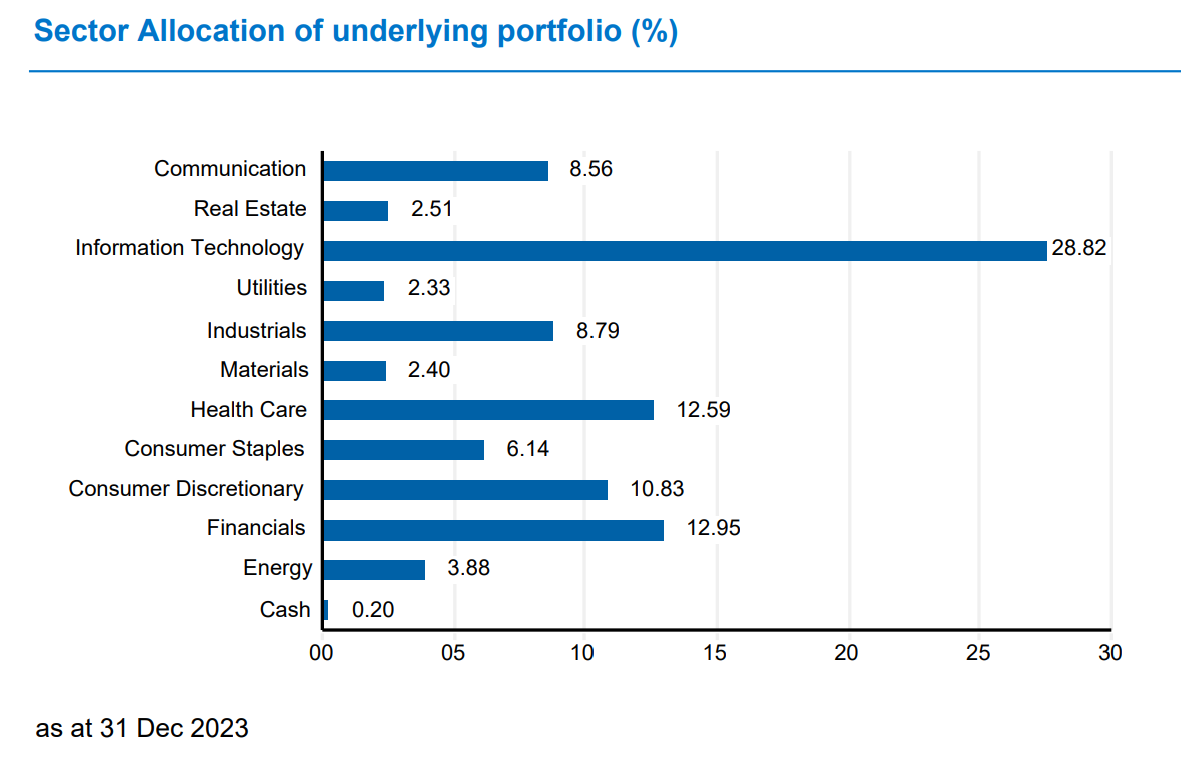 Source: Satrix S&P 500 Feeder ETF Minimum Disclosure Document, December 2023
Note that Information Technology is only 28.8% of the total fund, with significant exposure to other sectors like Financials (12.95%), Health Care (12.59%) and Consumer Discretionary (10.83%). Now, prepare yourself for the Nasdaq 100 chart:
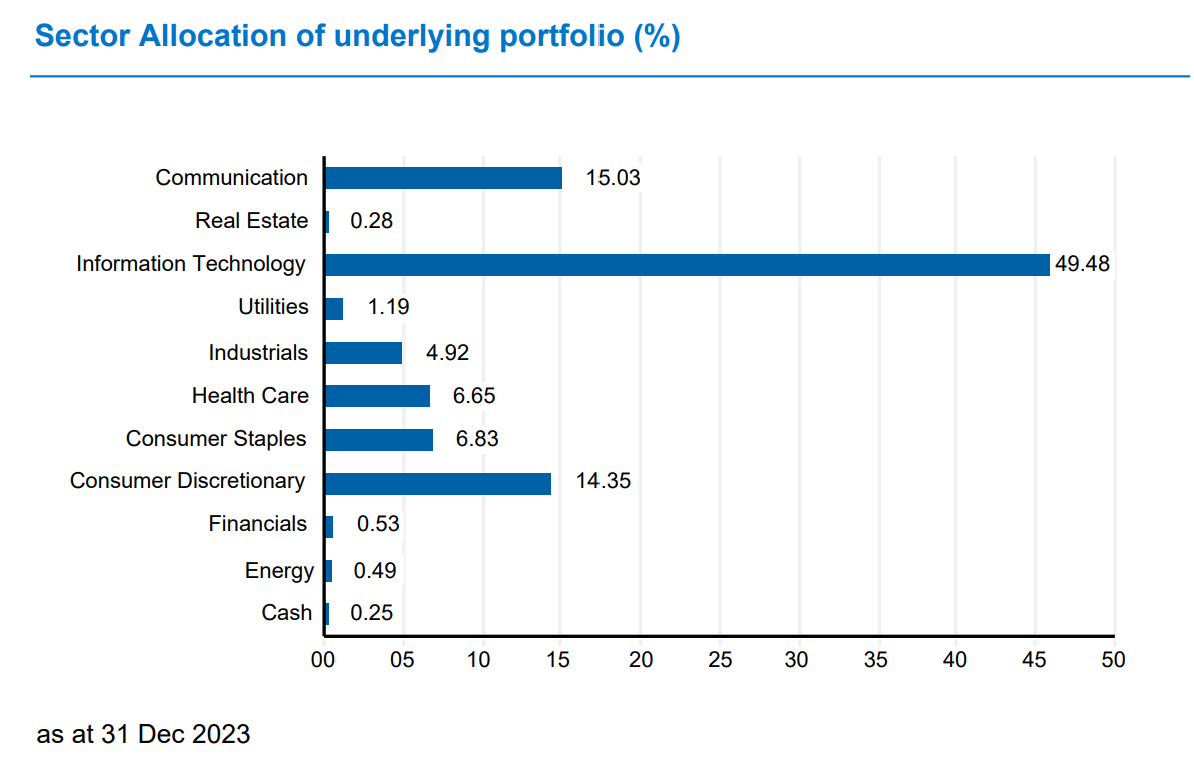
Source: Satrix Nasdaq 100 Feeder ETF Minimum Disclosure Document, December 2023
The Information Technology exposure jumps significantly to 49.48% - nearly half of the portfolio! Communication is also a lot higher than in the S&P 500, which makes sense as this sector has a strong technology flavour to it as well.
It’s not true that the Nasdaq 100 is exclusively a technology index. It is absolutely true that it has a much stronger bias towards technology than the S&P 500. For investors looking at ETFs tracking these indices, it’s very important to consider other exposures you might have and how these ETFs help with diversification and growth.
For example, if you already hold many of the Magnificent Seven stocks as single stock positions, then buying Nasdaq 100 ETFs won’t be doing much in the way of diversification for you. Conversely, if you already hold a healthy allocation of US banks, then the Nasdaq 100 ETF fits nicely alongside that exposure as a source of diversification.
I must also highlight that the Satrix Nasdaq 100 Feeder ETF had a total expense ratio of 0.48% as per the December 2023 Minimum Disclosure Document, which is a fair bit higher than the S&P 500 feeder ETFs.
Stars, stripes and basically everything else - right?
Just how important is the US relative to other global equity indices? The top ten positions in the Satrix MSCI World ETF will answer that question quite quickly for you:
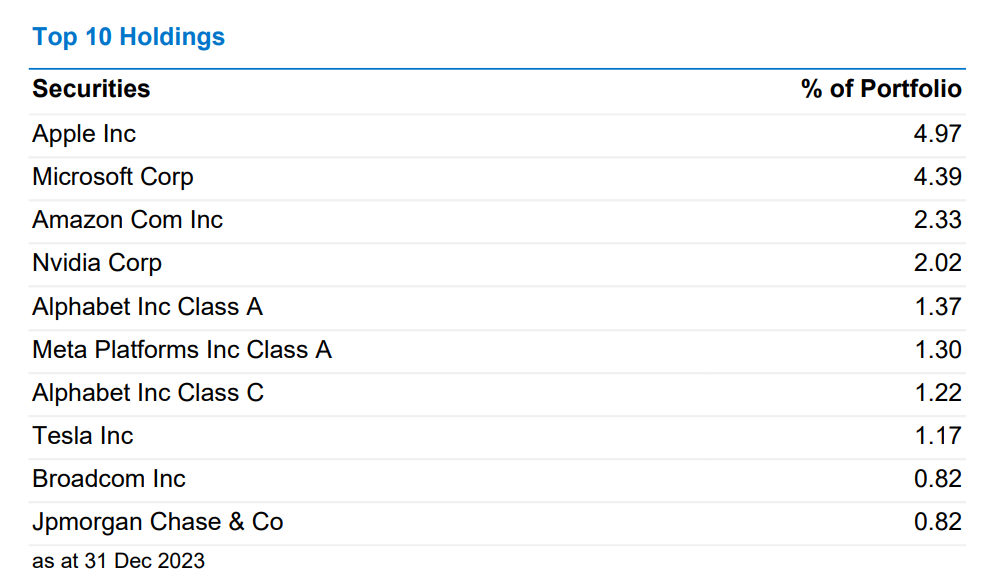
Source: Satrix MSCI World ETF Minimum Disclosure Document, December 2023
Doesn’t this look remarkably like the S&P 500, give or take a few different weightings?
I went and did some more digging and found a document from December 2023 that gives more information on the underlying index itself. It’s not the prettiest chart around, but here’s a pie chart from the document showing the regional exposure:
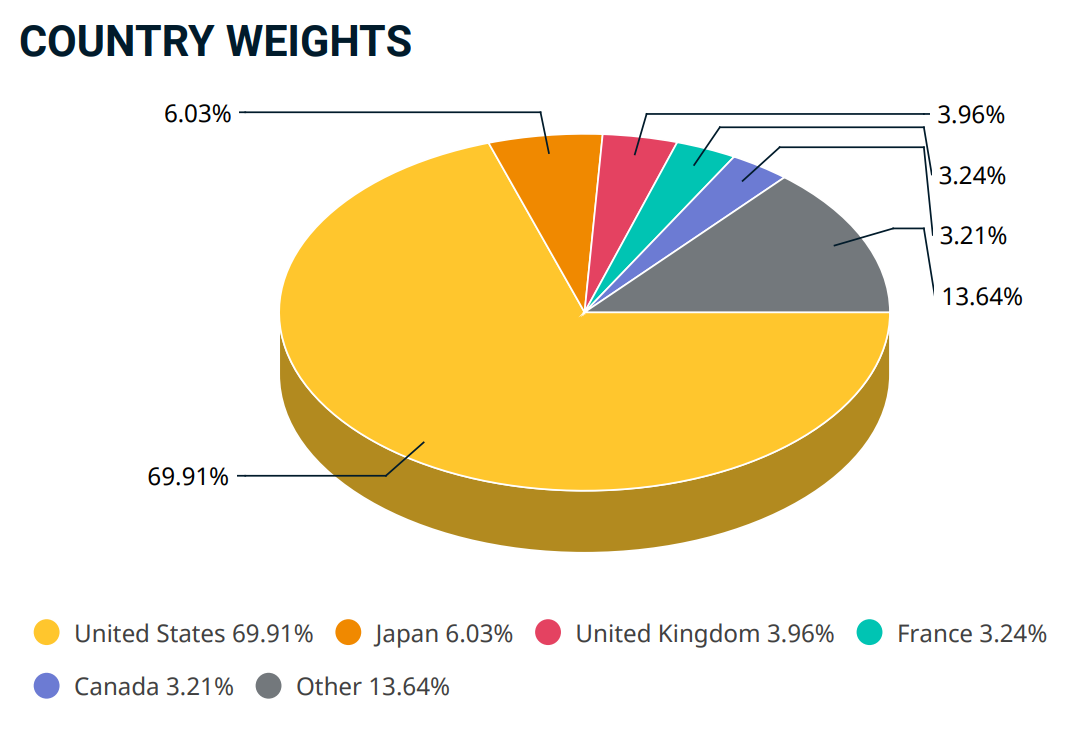
Source: MSCI World Index Factsheet, December 2023
As we’ve seen elsewhere, you had to look below the top ten exposure table to find the real differences to the other indices. In this case, you had to go find an entirely separate document to understand what makes the world index special: the regional exposures. It’s particularly interesting to note that the second largest region is Japan, with the UK, France and Canada also adding meaningful weightings.
For the sake of completeness, the Total Expense Ratio for the Satrix MSCI World ETF is 0.35%.
Not so passive after all, is it?
If you’ve learnt nothing else from this, I hope you’ve realised that the choice of ETF isn’t a passive decision at all. In fact, you always have to go check the Minimum Disclosure Document to see what the underlying exposures and costs are. You often have to look at overall sector allocation charts to see the differences, not just the top ten holdings!
Happy investing – and remember to maximise your tax-free savings account each year!
Want to know more about the latest research?


Any opinions, news, research, reports, analyses, prices, or other information contained within this research is provided by an external contributor as general market commentary and does not constitute investment advice for the purposes of the Financial Advisory and Intermediary Services Act, 2002. First World Trader (Pty) Ltd t/a EasyEquities (“EasyEquities”) does not warrant the correctness, accuracy, timeliness, reliability or completeness of any information (i) contained within this research and (ii) received from third party data providers. You must rely solely upon your own judgment in all aspects of your investment and/or trading decisions and all investments and/or trades are made at your own risk. EasyEquities (including any of their employees) will not accept any liability for any direct or indirect loss or damage, including without limitation, any loss of profit, which may arise directly or indirectly from use of or reliance on the market commentary. The content contained within is subject to change at any time without notice.
Search all articles
Posts by topic
- Market News & Events
- Easy Community
- Education
- Dividends Update
- Exchange Traded Funds (ETFs)
- Property Investing
- Managed Bundles
- USD Wallet
- Retirement Annuity (RA)
- Cryptocurrency
- Tax Free Savings Account (TFSA)
- International Investing
- Unit Trusts
- New to Investing
- Artificial Intelligence
- EasyProtect
- EasyCredit
- Shares
- Government Bonds
- New Listings